I noticed this year that on the HMRC personal tax portal they give you a breakdown of how your tax is spent on various services.
This is offered as raw data but also a pretty graph.
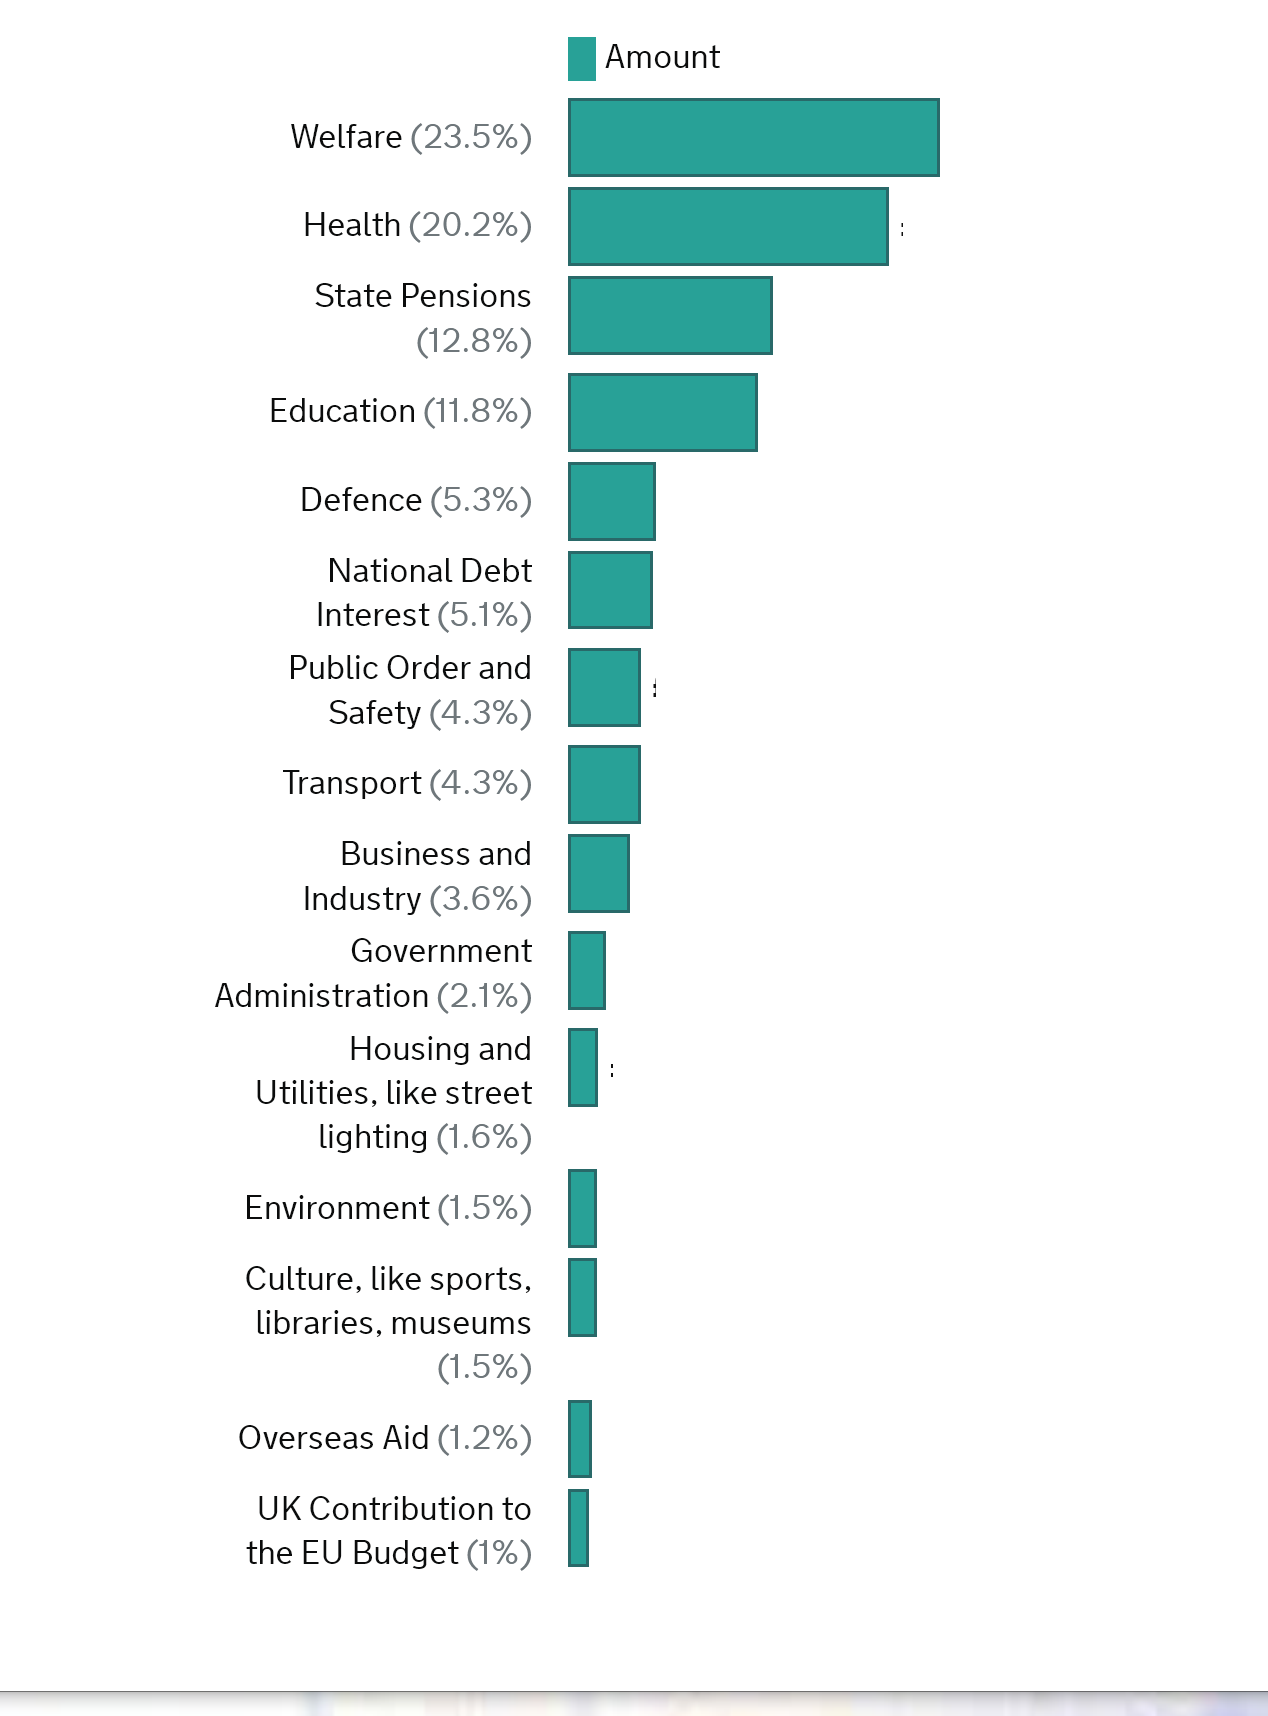
They also provide the data for the past 4 years, so I thought it would be interesting to track some of these categories to see how government spending has changed from 2016 to 2019.
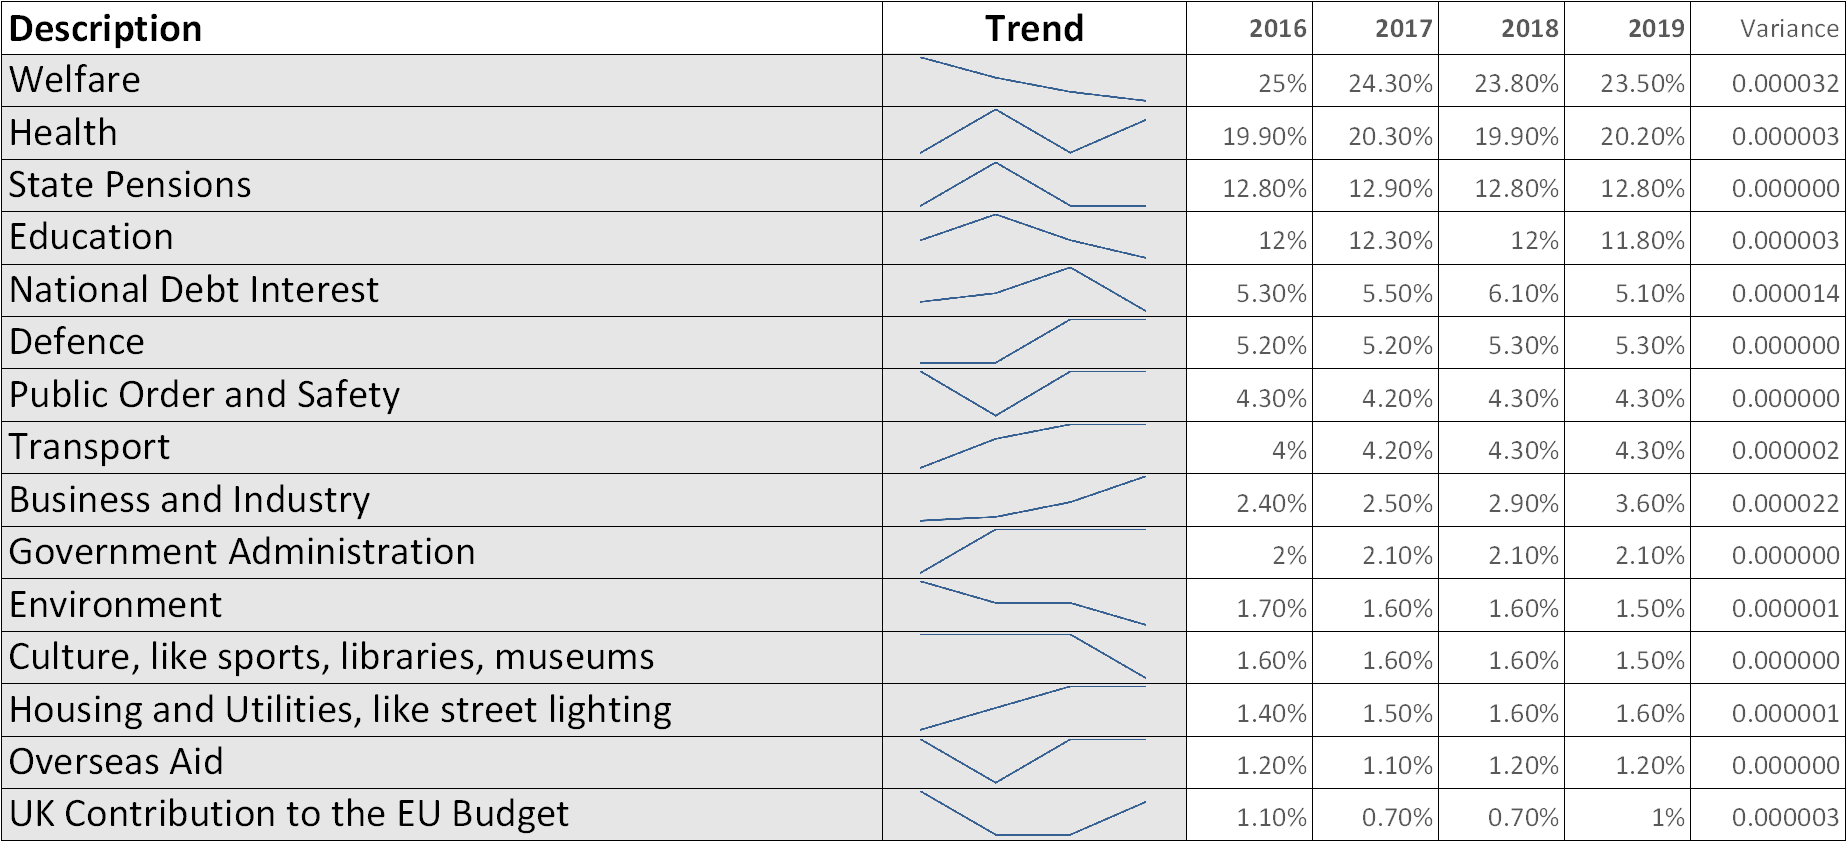
The graph line shows it best but in actual fact the changes in percentage are very small. The biggest changes are in Welfare (down) and Business & Industry (up).
If you do a personal tax return, this data is available in the online HMRC tax portal. Sign in, then select Self Assessment and then select ‘find out how your tax is spent’.